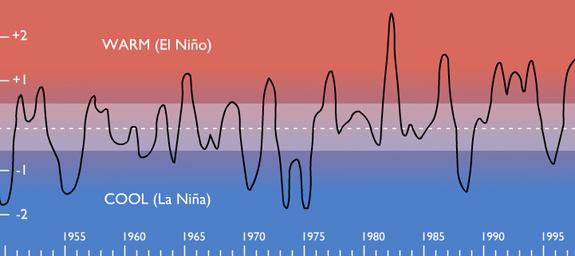
This graph shows how the Pacific Ocean's surface temperatures have warmed and cooled over the last 50 years.
El Niño events have occurred for tens of thousands of years. But they happen at irregular intervals, and their intensity varies from event to event. This graph shows degrees of changes from average sea surface temperatures:
+0.5 Celsius (Red) = El Niño conditions –0.5 Celsius (Blue) = La Niña conditions