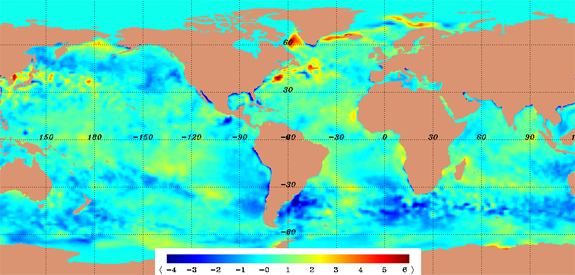
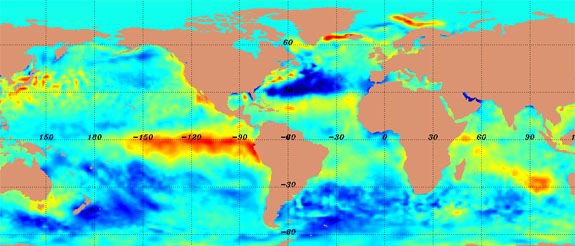
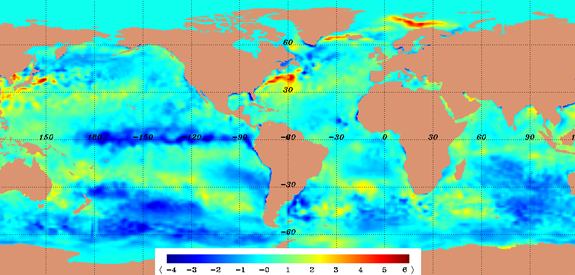
Top: Normal sea surface temperatures. Middle: Sea surface tempuratures during an El Niño. Notice the red areas to the west of South America. Bottom: Sea surface tempuratures during a La Niña. Notice the blue areas to the west of South America. Courtesy of the United States Navy (USN) Fleet Numerical Meteorology and Oceanography Center (FNMOC)